
CapCut is probably the most used video editing software on mobile. This app enables novices to create professional-looking videos with a plethora of filters, transitions, and special effects. Well, graphs are one of the easiest ways you can depend on to bring your footage to life.
It's no big deal if you are unfamiliar with this feature, as it is not as complicated as After Effects Graphs. This article will show you how to use graphs on CapCut.
How to Use Graphs on CapCut
The graphs on CapCut are two-dimensional graphs with time represented horizontally and changing values vertically. It demonstrates how different elements move or change over time, for example, speed changes, transitions, and camera motions like the zoom-in effect.
No matter what kind of animation you want to create, you first need to define the starting and ending points to mark different states, which are keyframes. So if it doesn't let you use graphs on CapCut, it's because there aren't keyframes in your clips.
Here are the steps on how to use graphs on CapCut, including how to use keyframes.
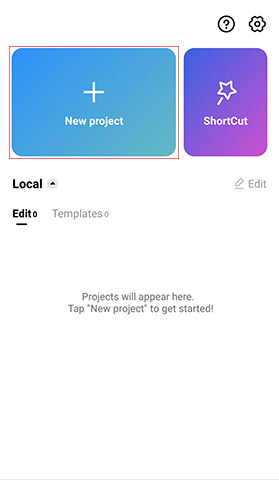
- Create a new project and add the video to use.
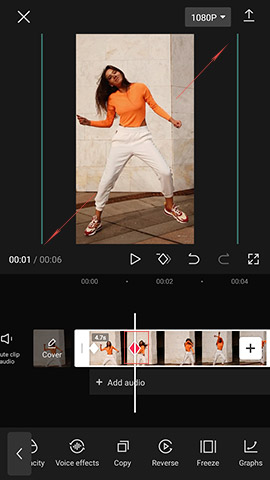
- Tap the video layer or click the Edit icon to select and edit it.
- Specify the point where you want the animation to start. Tap the keyframe button in the toolbar to add the first keyframe (a small diamond shape appears on the video layer).
- Insert the second keyframe and make some changes to this frame. For example, pinch your fingers on the screen to make a zoom-in effect.
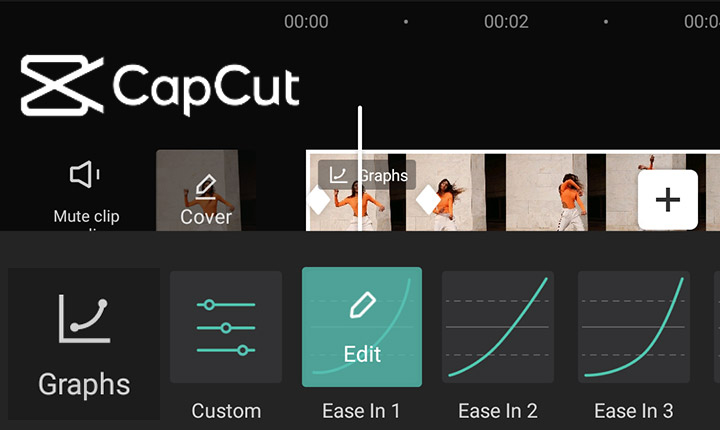
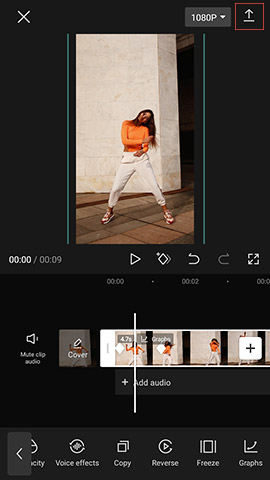
- Scroll the video layer to place the playhead between two keyframes. Then swipe the bottom toolbar to the far left until you can see the Graphs button.
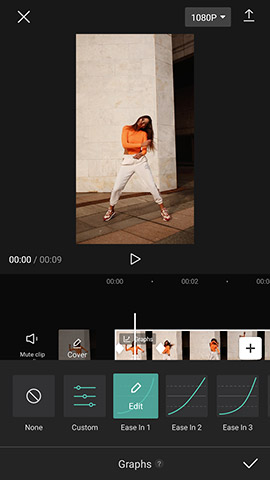
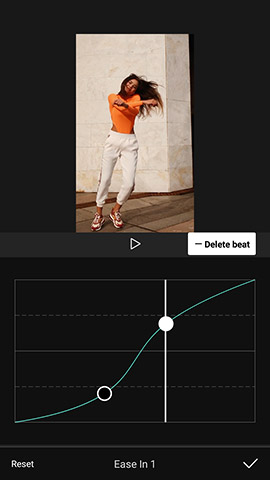
- Click the Graphs button and choose one of the presets you like.
- Press the pencil icon to edit the effect. The steeper the curve is, the faster the speed of the animation will be. You can flatten the curve to make the animation move slowly and smoothly.
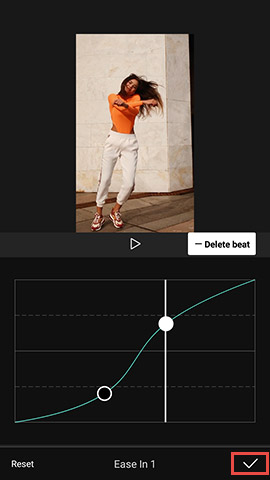
- Save the edits by clicking the check mark at the bottom right.
- Click the Export button to save the edited video.
The graphs features can be applied in many situations. For instance, when you are adding transitions, using keyframes, making 3D zoom effects in CapCut, you can apply the graphs to ease the motion. For more tips and tricks, read our ultimate guide on How to Use CapCut.
Use Graphs on CapCut for PC
You can also use graphs on CapCut for PC if you prefer to edit videos on the desktop. Since there's no English version for CapCut for PC (JianYing Pro), consider an alternative to CapCut if you fancy an English interface.
VideoProc Vlogger is a good alternative. People love CapCut because it's free and easy to use. That's what makes VideoProc Vlogger attractive. There's no steep learning curve with VideoProc Vlogger, so you don't have to invest lots of time as you do with the big names. And it will always be free and with no watermark. Besides, VideoProc Vlogger offers almost all the features you may need for video editings, such as transitions, video effects, and text templates. You can also color grade your footage and edit the audio like a pro.
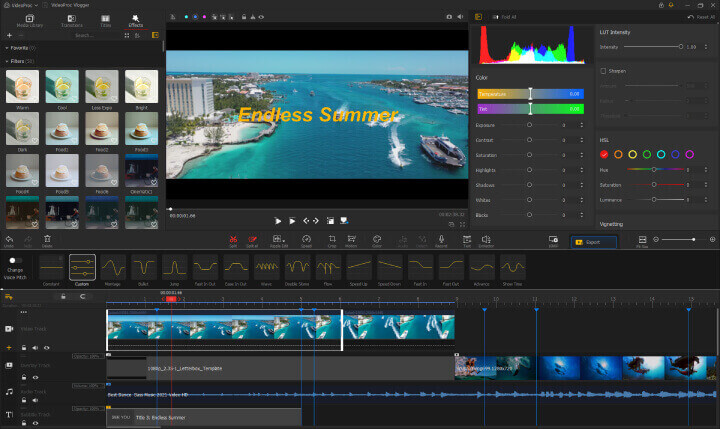
The best part is that you can still use graphs in VideoProc Vlogger to make the animations in your video feel like butter, thereby improving the storytelling. There are 14 graph presets available in VideoProc Vlogger, and you can customize your own graphs as well.
Download VideoProc Vlogger and upgrade from the default transitions. Create smoother animation effects in your video.

VideoProc Vlogger - Use Graphs on CapCut for PC
- Totally free and forever free with no watermark.
- 14 graph presets for smoother animations.
- Easy to use with the self-explaining interface.
- Rich transitions, filters, and effects are available.
- Comprehensive text guides and video tutorials.

FAQ
How do I use the graphs in CapCut?
You need to add keyframes in your video clip to use the graphs. Add at least two keyframes. Scroll the video layer to place the playhead between the two keyframes. Swipe the bottom toolbar to the far left to see the Graphs button. Then you can click on it and add one of the presets as you like.
How do you add a keyframe CapCut?
Create a new project and add the video to use. Tap the video layer to select the video clip, and you'll see the keyframe button in the toolbar. It's a small diamond-shaped icon. Tap it then a little diamond shape will appear on the video layer. That means you've added a keyframe successfully.