The term Histogram can be daunting for beginners, especially when you see those curves and parameters in DSLR cameras, photo editing software, or color grading tools. In fact, it is a handy tool and will efficiently facilitate your photography, both in terms of pre-production and post-production.
What is Histogram
Instead of giving you an abstract definition, let's jump right into a specific case by analyzing the cave photography below.
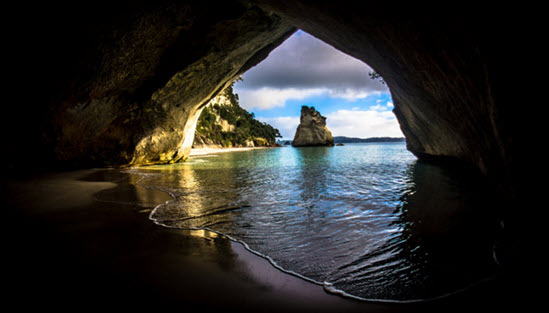
Different parts of the picture have varied brightness. For instance, the cloud and sky are the brighter parts, the cliff that reflects the sun is probably the brightest section, while the cave is the darkest part.
Let's imagine it is a black and white photo. Still, you will find the sky area represented by lighter gray, and even white, and the cave area is darker gray or black. Each pixel has its own degree of luminance, like the simplified representation below.
We can count the numbers of pixels at different grayscale levels, and rearrange them into groups. Put the darkest pixels at the left, the brightest pixels at the right, and others in between.
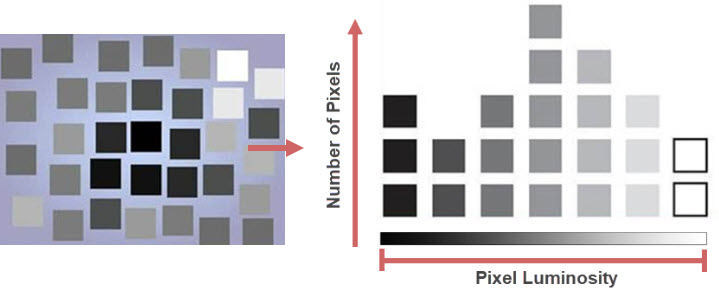
As you can see, the horizontal axis represents the luminance level of the pixel, and the vertical axis tells us how many pixels there are under that specific luminance level group. For instance, there are 3 darkest pixels, 2 brightest pixels, 3 pixels a little darker than the brightest pixels, and so on. The dark and gray pixels have the largest amount, corresponding to the fact that the dark area takes up a large section of the photo.
That's the simplified version, and the groups of each shade of gray are separated. In reality, the distribution of light is continuous. If we count and group all the pixels of an image to the axis, according to their luminance level, we will have the following histogram graph. Note that the distribution of the pixels in every shade of gray are continuous.
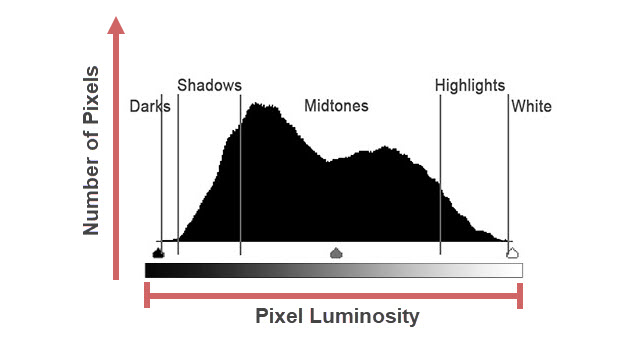
For the 8 bit monitor, the luminance value is between 0 and 255.
The left parts are dark and have shadows, and the right parts are highlights and white, and what's in between are the midtones.
How to Interpret Histogram
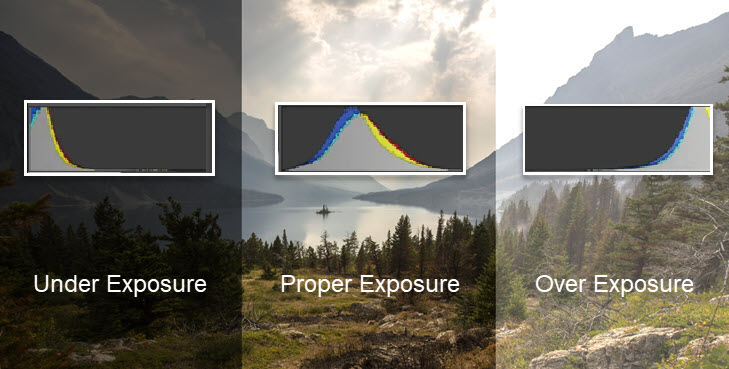
How would you expect the histogram to look like for this photo? It is quite dark, with most of its content in the shadows. In other words, there are a large number of pixels that have a darker luminance level, and few pixels that are bright.
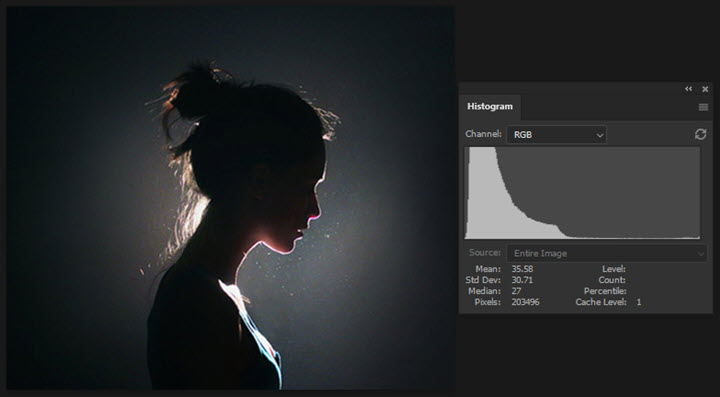
Now looking at its histogram, the pixels stack at the left part, the shadow area.
As for this photo, it is quite bright overall. Its histogram looks like this, the main body moves to the right, indicating that most of the pixels are bright.
How about this one? You have the blacks and whites, and many shades of gray. Affirming by its histogram, the luminosity is evenly distributed. In other words, properly exposed.
How to Utilize Histogram When Shooting a Photo/Video
In terms of preproduction, the histogram can help us in the following aspects:
1. Adjusting the Camera for the Proper Exposure
By proper exposure, we are referring to the technical aspects here, that is, avoid clipping, make sure there are details in the shadows and highlights, and the photo will not be underexposure or overexposure. That is to discriminate from the artistic concerns. For instance, if you want to convey a depressive mood, you might want to shot an underexposure photo on purpose. Artistically, that luminosity level is "proper" for your end.
Back to the technical aspects. The histogram helps us to measure the luminance level before or after we take a shot. You may be wondering, why not directly look into the screen? The short answer is, the screen or our eyes can lie to use sometimes. For instance, when you are shooting outdoors under direct sunlight, the screen may appear overexposure.
With the histogram, we can read the graph and make adjustments in the camera accordingly, both before and after the shot.
If you see pixels accumulated at the left most edge, it means you have pure black on the image, and the shadow part is losing details; similarly, if the histogram is heavily bunched to the right, with pixels touch the right most edge, you are losing details in the highlights. You can adjust aperture, shutter speed or ISO depending on the specific situation.
2. Keep an Eye on the Dynamic Range of the Scene and of Your Camera
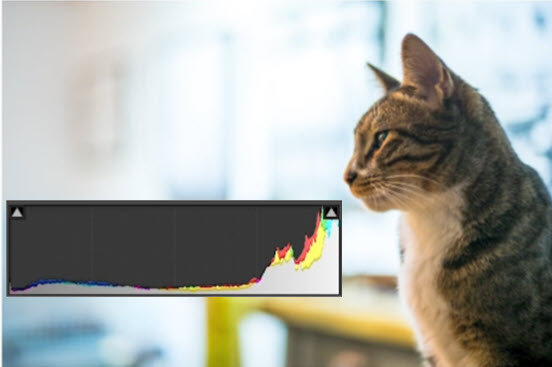
The histogram can alert us in ultra-high-contrast scene shooting. If you see both the shadow part and the highlight part have pixels hitting the edge, it means the dynamic range of the scene is higher than your camera's capability.
Let's say your camera is capable of shooting a 5 stop dynamic range, and the dynamic range of the scene is a highly contrasted one, reaching 10 stop. You won't be able to squeeze the luminance level into the 5 stop camera in one shot.
Human eyes can adapt to the scene of a much higher dynamic range than digital cameras, that's why a single shot will not represent how the scene looks like to our eye.
In such a case, you can go with exposure bracketing. Take one underexposure photo, one overexposure photo, and one that places the main body of the histogram inside the axis. In post-production, you can then blend these photos into an HDR.
3. Adopting the "Exposing to the Right" Technique
Exposing to the right means deliberately overexpose the image, to the highest possible range, without clipping the highlights. The reason is to leave more room in the post production, when bringing back the histogram to the proper exposure.
Why the hassle? Comparing to low light, bright light has more energy, and can generate better signals in the camera's sensor. On the contrary, a low light image has a lower signal-to-noise ratio, meaning more noise than the highlight area. Exposing to the right can effectively raise the signal-to-noise ratio when shooting in RAW.
By utilizing the histogram, you can adjust the aperture or shutter speed to bring the pixels' luminance to the right, and ensure that no pixel is stacking at the right edge. In that way, you can crush the overexposure, without risking clipping.
That said, it doesn't mean you have to overexpose every time. There are certain situations to resort to this technique. You can read more on exposing to the right for its dos and don'ts.
How to Utilize Histogram in Post-Production
The histogram tool is one of the scopes in color grading that we can use to analyze the parameters. Fully-fledged photo editing software and video editors always have the histogram built-in, such as Lightroom, Photoshop, Davinci Resolve, Premiere Pro, Final Cut Pro, etc.
Technically, you can rely on the histogram to notice exposure problems, and fix unintended overexposure or underexposure, while always keep an eye on the real-time changes in the histogram. We won't elaborate on this since you already know how to interpret the exposure problem from the previous part.
Artistically, the histogram can help you to achieve a certain mood and style, by monitoring the tonal range and displaying the changes when you are dialing the color wheel or dragging the curves.
To better understand the tonal range, what it has to do with the aesthetics in color grading, and what the role the histogram plays in this regard, let's take a look at High Key vs Low Key photos, and High Contrast vs Low Contrast photos.
1. High Key vs Low Key Photos
Take a look at the following photo and its histogram. We can see the photo is taken with daylight, and most of the parts are quite bright, with white walls and windows (blurred but still distinguishable).
On to the histogram, most of the pixels are bunched to the right, and there are few pixels in the midtones and shadows.
The region where most of the pixels present is called the tonal range. When a picture has a tonal range that resides mainly in the highlight part, we call it a high key photo.
Portrait photos, scenery photos feature snow, sky and white walls, and backlit photos are likely to be high key photos.
On the contrary, when the tonal range falls on the shadowy part of the histogram, the most of the pixels bump up to the left side, you have a low key photo. When the photos are about starry nights, nightscape in the city, sunset, and so on, they are more likely to be low key photos.
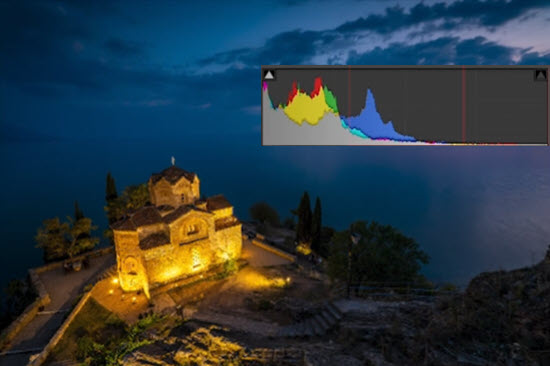
Therefore, when you see a histogram with most pixels stacks at the left, and it is a low key photo, then it is still a properly exposed photo, instead of being a problematic underexposed one.
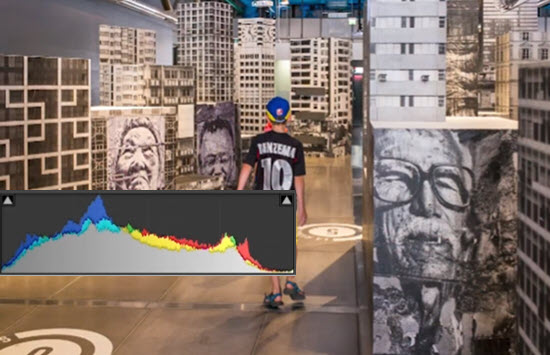
When the pixels are distributed across the shadow, midtone and hight light range, with the midtone having the most of the pixels, and tapering on both sides, it is a midtone photo.
Adjusting the tonal range will have a large impact on how the viewers feel about the photo. For a photographer, the "proper" exposure is more artistically decide and act upon.
2. High Contrast vs Low Contrast Photos
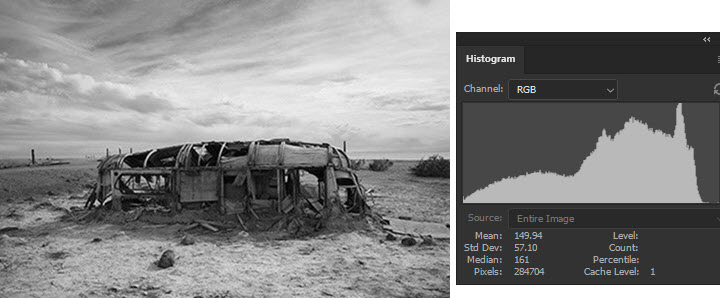
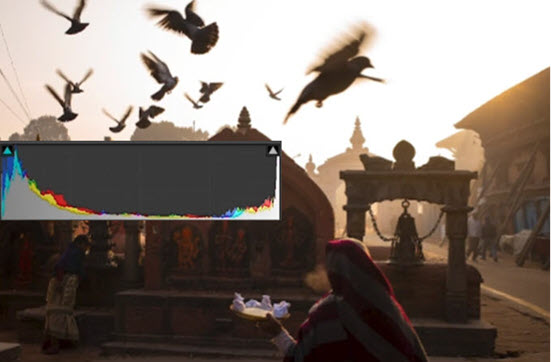
Another aspect how to do with the contrast. When there are spikes at both the shadow part and the hightlight part, it means there are many pixels that are darker, and there are also lots of pixels that are lighter. The result is a highly contrasted photo.
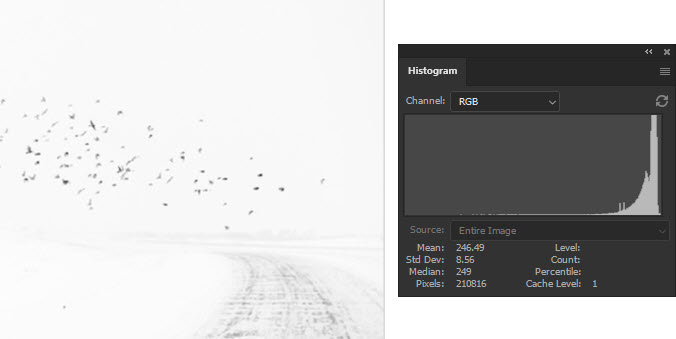
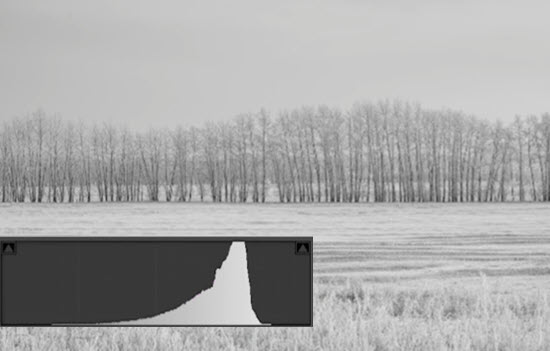
When the curves concentrate on a specific region, that is, you only see one spike, and the tonal range is narrow, then the photo is a low contrast one. Photos featuring foggy days, snowy scenes are likely to be low contrast photos.
Besides histogram, there are other scopes such as waveform and vectorscope to help you better understand the color and luminance of your video. You can read the complete color grading workflow for a systematic learning.